
Introduction to the Mathematical Basis of Diffusion and Problem Analysis
The core issue of the generation model is:
We hope the model learns a data distribution
For example: facial image distribution, handwritten digit distribution, circular cloud distribution, text, audio, and video distribution, etc.
However, data distributions are usually complex. We cannot directly describe their distribution and density functions, so we need some techniques to solve these problems.
Many people are intimidated by a bunch of formulas when getting started with diffusion models. In fact, the principle of diffusion is quite simple. This content uses simple code to explain the diffusion model, allowing everyone to get familiar with VAE and ddpm without having to derive complex formulas.
In the first part of this chapter, we will explain the mathematical foundations required for diffusion models, which are mainly used for subsequent formula derivations. If you want to directly experience the diffusion model, you can directly refer to the content in the second part. It is a simplified version of VAE and DDPM, providing a complete and simple diffusion experience. In the third part, based on the content in the second part, we explain that some functions in the second part cannot be obtained, which is why we need a diffusion model.
I. Mathematical Foundations
1. Bayesian Formula
When learning about Bayesian formulas, we often see the following form:
The core idea of this formula is: After seeing a result, infer the most likely cause of it.
In tasks such as machine learning, statistical inference, image recognition, and natural language processing, the Bayesian formula is very important. Let’s understand each symbol in the formula one by one.
| Symbol | Name | Meaning |
|---|---|---|
| Hidden variable / Underlying cause | Represents a cause that we cannot see but want to infer | |
| Observed data | Represents data or phenomena that we have seen | |
| Prior probability | The probability that the cause |
|
| Likelihood | The probability of observing the data |
|
| Posterior probability | The probability that the cause |
|
| Evidence / Marginal likelihood | The total probability of observing the data |
It is usually not directly observed, but rather the reason hidden behind the data, hence it is also called hidden variables.
For example: When observing a patient’s symptoms, we want to determine what disease they have.
For example: a set of symptoms.
In the Bayesian formula, we infer the underlying cause
That is to say:
For example, if someone shows symptoms such as “fever, cough, and runny nose,” it can be caused by many factors: cold, influenza, allergies, pneumonia, or other diseases.
Therefore,
If the possible cause is discrete, it can be written as:
Its main function is to normalize the probabilities, so that the posterior probabilities of all possible causes add up to 1.
For example, when determining whether a person has a cold, if it is the flu season, the probability of the cause “cold” occurring is relatively high; if it is not the flu season, the probability may be lower.
Therefore,
For example, if someone really has a cold, what is the probability of symptoms such as “fever, cough, and runny nose”?
The relationship here is:
It measures whether a certain cause can well explain the phenomenon we observe. If a cause can well explain the observational data, the likelihood is relatively high; otherwise, the likelihood is low.
This is what the Bayes’ theorem ultimately aims to achieve.
For example, when we see a person showing symptoms such as “fever, cough, and runny nose,” we want to know the probability that they are really sick:
Therefore, posterior probability can be understood as: a re-evaluation of the cause after seeing the result.
The role of the Bayes’ theorem is to combine the prior probability and observation data to obtain the posterior probability.
Bayes’ Theorem:
It can be understood as: Posterior probability = Likelihood × Prior probability ÷ Evidence
That is:
| Formula Item | Intuitive Explanation |
|---|---|
| How many possible causes exist after seeing the result | |
| How many possible results if the cause is valid | |
| How many possible causes originally | |
| How common the results are overall |
Therefore, the core function of the Bayes’ theorem is: to update our judgment about a cause based on the observed data and existing experience.
2. Jensen’s Inequality
For the concave function
For convex functions
In machine learning, usually
In many models, what we want to maximize is:
So:
This thing is usually not easy to optimize directly. Jensen’s inequality can help us construct a lower bound, that is:
$ \log p(x) \geq \text{某个可优化的目标} $
This lower bound is the core of many generative models.
3. Gaussian Distribution
The Gaussian distribution, also known as the normal distribution, is the most commonly used distribution in generative models.
One-dimensional Gaussian distribution
One-dimensional Gaussian distribution is written as:
We can calculate his probability density function below.
We can start with the simplest standard normal distribution:
The density function of the standard normal distribution can be written as:
Here,
Substitute
And the Gaussian integral is:
So:
Solution:
Therefore, the density function of the standard normal distribution is:
Let the random variable
For a one-dimensional Gaussian distribution, it can be normalized to a standard normal distribution.
Let:
Then the standard normal density function is:
Because:
So:
According to the density transformation formula for continuous random variables:
Substituting
Continue to substitute the standard normal density function:
Organized:
Therefore, the density function of the normal distribution is:
Among them,
Multidimensional Gaussian Distribution
In the embodied domain, images, hidden variables, and 2D points are usually not one-dimensional variables, but multi-dimensional vectors.
Multidimensional Gaussian distribution notation:
The density function is:
Where:
If the covariance is a unit matrix:
Then it is standard multi-dimensional Gaussian:
4. KL Divergence
KL divergence is used to measure the difference between two probability distributions, and is also commonly referred to as relative entropy.
Assume there are two probability distributions: true distribution:
Then, the KL divergence from
If it is a continuous random variable, then:
The KL divergence can be understood as: when the true distribution is
That is to say:
Give a simple example
Assumption:
Then:
If natural logarithm is used, the result is approximately:
The relationship between KL divergence and cross-entropy
Cross-entropy is defined as:
Entropy is defined as:
KL divergence satisfies:
Therefore, in machine learning, minimizing cross-entropy is equivalent to minimizing the KL divergence when
Thus, it can be seen that the KL divergence measures: how much information is lost on average when approximating the true distribution
II. Generate Basic Introduction Cases
Talking directly about VAE, DDPM, and FM might confuse people. I was also confused when I was learning at first. So, with a simple example, I aim to give everyone a basic understanding of the generation process, which will be very helpful for learning about diffusion models later on. Now, I will explain the basic generation steps using circular distribution. Let’s get started~
This example is ideal for beginners, as the functions, density, and sampling process of the ring are all able to be explicitly constructed. It also introduces the basics based on the generation structures of vae and ddpm. Later on, in the third part of this chapter, we will briefly explain why vae, ddpm, or other diffusion models are necessary.
We will not train any neural network yet, but use handwritten rules to simulate three generation approaches:
-
Direct sampling: Sampling directly from the mathematical definition of the circle.
-
Simulate VAE sampling: First, sample from the latent variable prior, and then generate circular points in one step using the decoder.
-
Simulate DDPM sampling: Start with Gaussian noise and then remove noise step by step until it reaches the circle.
The target distribution is a two-dimensional circle:
We want to generate a batch of 2D points:
And these points lie on the circle with radius
For example, let’s say:
Then the goal is to generate a distribution like this:
text        * * * * *
     *             *
   *                 *
  *                   *
  *                   *
   *                 *
     *             *
        * * * * *
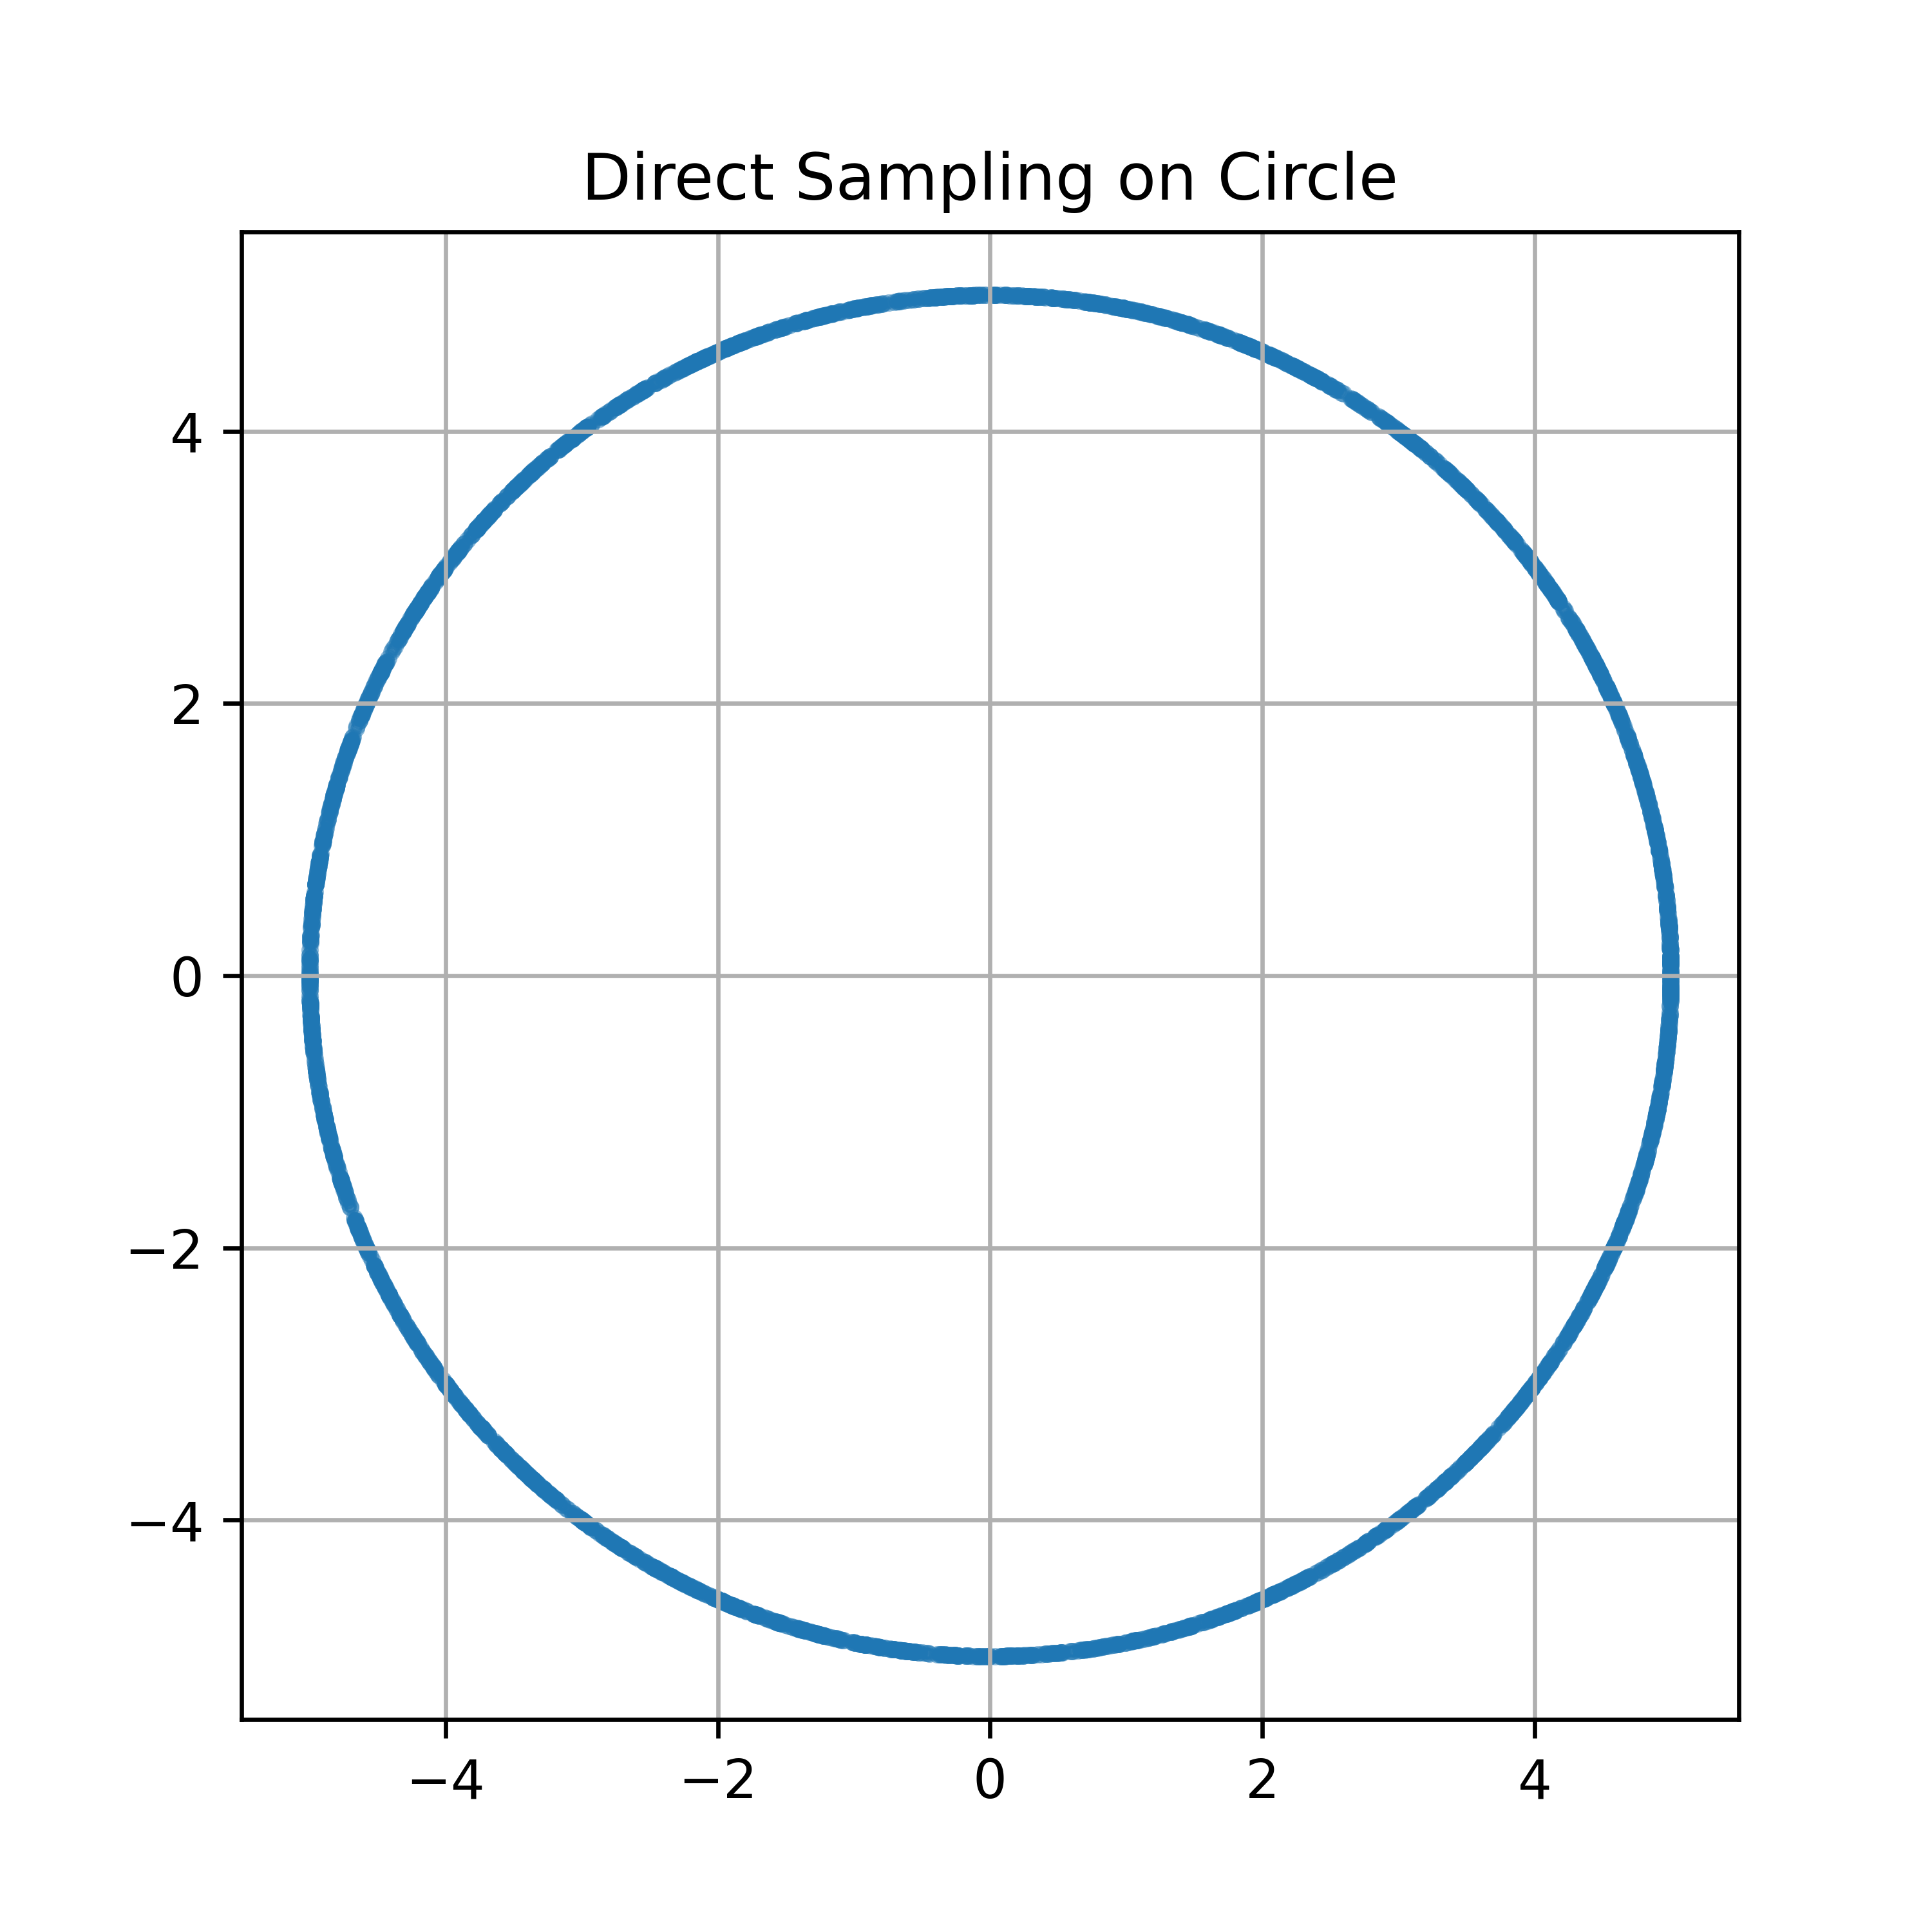
Method 1: Directly sample the circumference
A point on a circle can be parametrized using an angle:
If we want the points to be evenly distributed on the circle, we just need to distribute the angles uniformly:
Then calculate:
This is the most direct circular sampling. As long as you know the explicit form of the target distribution, you can sample directly.
The implementation refers to the direct.py file in the reference code, and the effect is as follows:
Method 2: Simulate VAE sampling around the circle
The generation process of VAE is usually as follows:
The most common prior is the standard normal distribution:
If the decoder is deterministic, it can be simplified to:
In other words, the core generation logic of VAE is: first sample the latent variable z, and then generate x through the decoder.
We can design a handwritten decoder:
Among them:
Then project this 2D Gaussian point onto the circle with radius
Among them:
Expanded writing is:
The implementation refers to the vae_imitat.py file in the reference code, and the effect is as follows:
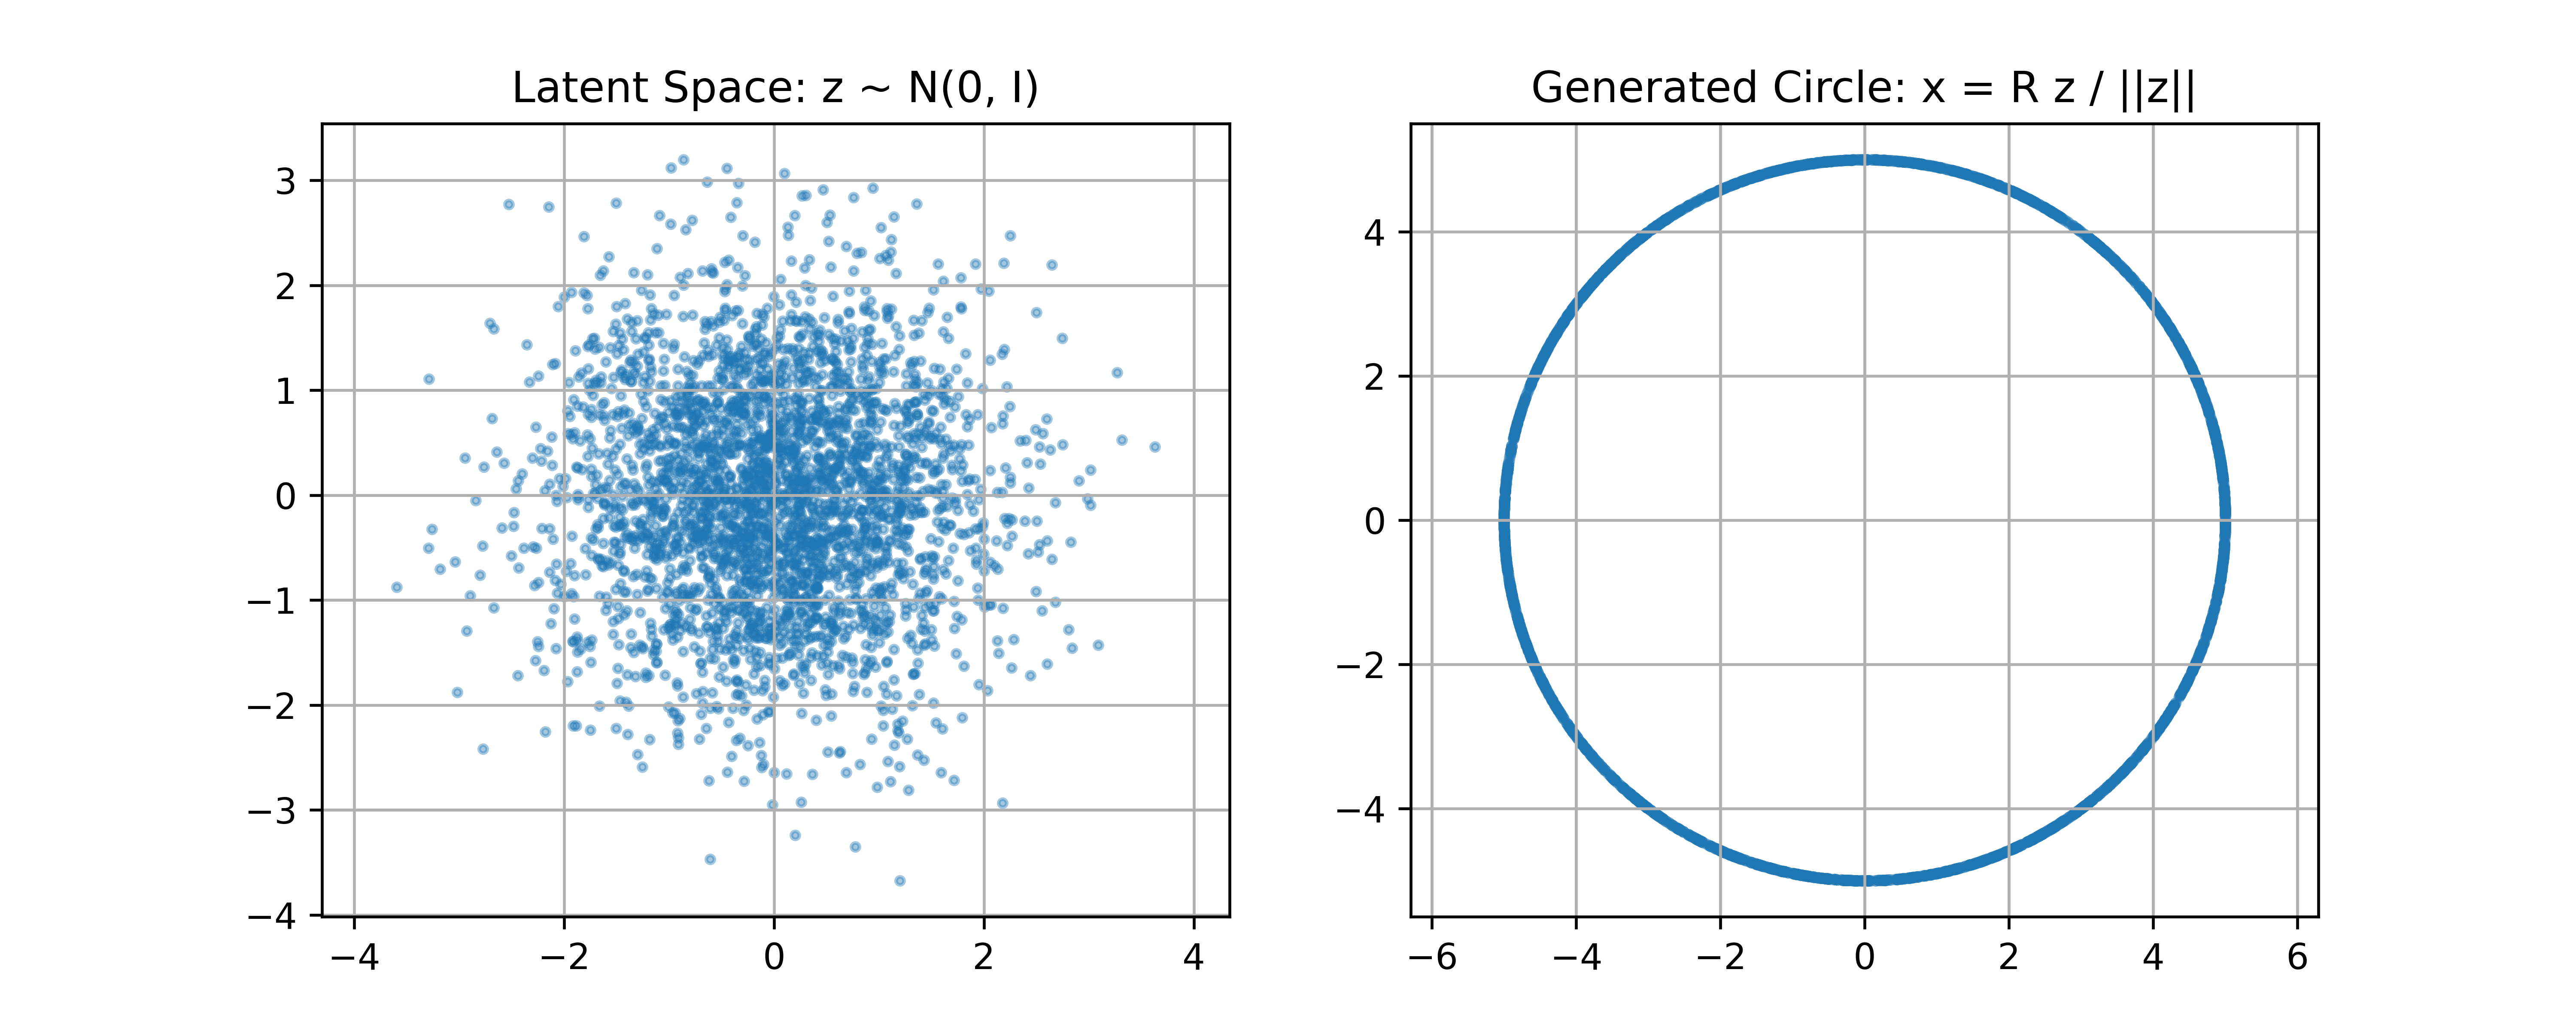
When vae is actually generated, it is produced in one step. This may lead to a biased average result, which is why ddpm is used. This is something that everyone should have a basic understanding of; we will discuss it in detail when we cover vae separately.
Differences between DDPM and VAE
VAE is:
It is generated in one step.
DDPM is:
It is multi-step generation.
Method 3: Simulate DDPM sampling around the circle
The generation of DDPM is not completed in one step.
Its generation process is:
Then, perform noise reduction step by step:
The data samples are finally obtained:
For the circular distribution, the goal is to end up with:
The true DDPM has two processes: 1. Forward noise addition, 2. Reverse denoising.
For beginners, we can first write a manual denoising rule to simulate the sampling process of DDPM.
Core idea is:
-
Start with Gaussian noise.
-
Each prediction should produce a “clean circular point”.
-
The current point approaches the predicted circular point.
-
Add a little more noise at each step, with the noise getting smaller over time.
-
Finally, the point falls near the circumference.
For any current point
This can be regarded as a handwritten denoising model. In the actual DDPM,
Let the current point be
Then update:
Among them:
Here:
The implementation refers to the ddpm_imitat.py file in the reference code, and the effect is as follows:

You will see a process:
text标准高斯噪声 -> 点逐渐被推向圆周 -> 最后形成半径为 R 的圆
III. Simplified Parts of the Actual Model
1、VAE
The true VAE is:
Among them,
Common forms are:
During sampling:
Among them:
In our simplified version:
Replaced with:
2、DDPM
The forward process of the true DDPM is:
Train neural network:
During sampling, from:
Start and gradually remove noise.
In our simplified version, the neural network prediction is replaced by a geometric projection:
In other words, in the actual DDPM, the neural network learns to denoise x_t into x_0. In our simplified version, we directly project x_t onto a circle using handwriting rules.
In real tasks, we cannot directly obtain distributions that are similar to the circular distribution and can be expressed by mathematical formulas. Therefore, we need to use techniques such as neural network encoding-decoding and re-parameterization to learn the distribution.
How vae, ddpm, and fm specifically learn distributions, generate data, and implement cutting-edge embodied diffusion generation applications such as dreamdojo and dreamzero, as well as other embodied generation technologies like jepa and lewm, will be explained in more detail in subsequent chapters. I hope you gain some insights from this chapter and have a basic understanding of diffusion models.
Thank you all for reading. Fasten your seat belts! Let’s continue to the next chapter~